With the electricity prices, it obviously does. But apparently, it keeps you company, too. According to the Social Report 2006, experiences of loneliness dramatically decreases as you get richer. Higher income also makes you more trusting.
So much for Citizen Kane's you-will-die-bitter-and-alone theory.
Another strange little gem is that more and more people are having multiple ethnic identities. In 1991, there were 4.4% more ethnic identifications than there were people surveyed - i.e. it can be very roughly concluded that around 4.4% of people identified with more than one identity. In 2001, this figure almost doubled to 8.5%. So, either more people identified with multiple ethnicities, or people identified with more ethnicities than before.
With income inequality, it's interesting to note that the biggest jump came in the late 80s/early 90s (duh), but that during National's first two terms, not only did it plateau overall - it experienced the only substantial dip in 16 years. But with most of the jump happening before 1991, it's hard to blame this Labour government for it (about a quarter of the increase in income inequality has happened under Helen's watch).
What's been most picked up by the MSM, though, is the increase in "severe hardship". Brian Easton has a thorough critique of the index used to measure hardship on No Right Turn, but working with the data on face value, it's very interesting to see just which groups score high on hardship.
Top of the list, solo-parent families. 55% of them were reported as having "low living standards" in 2000. By 2004, this percentage grew into 60%. Pacific Island families was just as bad, going from 49% to 54%. This is followed by families on income-tested benefits, then 18-24 year olds and people renting from private landlords.
A much more detailed picture is available in the form of the "Population with Low Income" data. Unlike the "hardship" stuff, this is based on a comparison of household/individual income with the median income. In particular, figuring out who has an income after housing cost that is 60% less than the median. It has more data points, and gives a much clearer picture.
For example, in 1987-88, 13.9% of solo-parent families were below the 60% line (i.e. "poor"). By 1992-93, this went up to [glup] 63.3%. By 1997-98, it dropped to 51%, went back up to 60.7% in 2000-2001, and by 2003-04, it dropped to 43%.
For families on income-tested benefits, 25.1% of them were poor back in 1987-88, this tripled by 1992-93, before dropping back down to 51.2% in 2003-04.
The patterns are glaring, they underlie all the socioeconomic data, and they all point to the blazingly obvious - there were a lot of changes between the Fourth Labour Government and the first term of Bolger's National Government. A lot of people got shafted. It's taken over a decade to heal. The healing isn't done.
Business as usual, then.
--
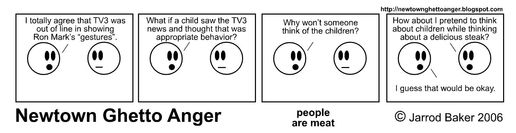
And here's last week's NGA that I was a bit slack in posting. And as an addendum, my belated two-cents on Ron Mark: I rather like the idea of MPs not having the human trained out of them. Doing the finger in jest is a bit naughty, but honestly, you'd have to be quite a prick to attach any kind of moral significance to it. Abusing a position of power to exploit a vulnerable person for financial gain, on the other hand...
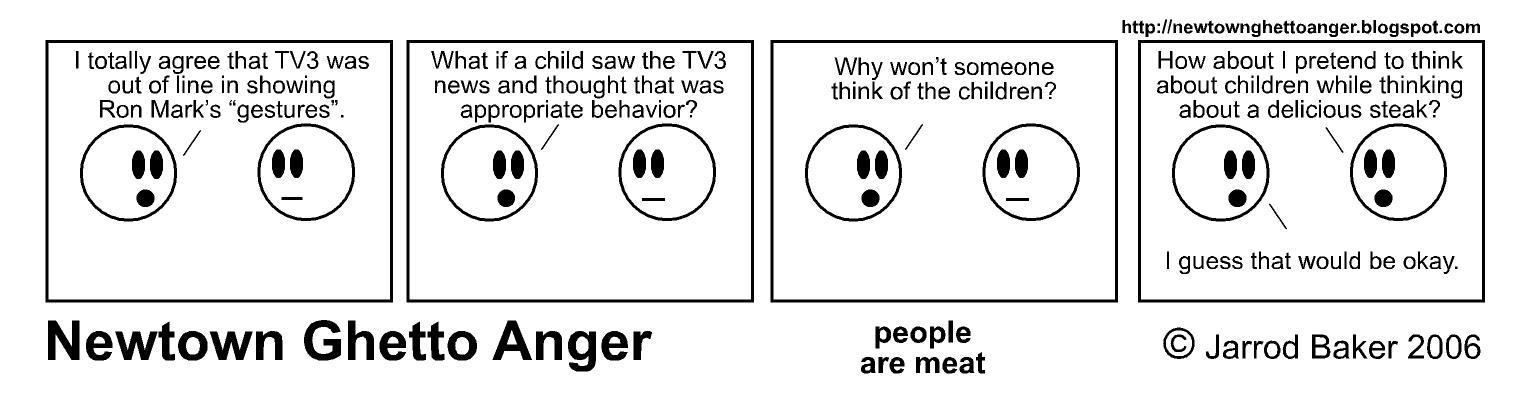
As usual, click here for more NGA.