Posts by David Hood
-
Just returning to further (and more seriously this time) justify my earlier choice of "climate strike", because the mass action (and it's growth) is a new thing of 2019- demanding a response rather than just acknowledging there is a problem.
-
Climate Strike
because we are not living under rocks
and
protofascism
because there is so much around in the decline of grand empires.
-
Code
https://gist.github.com/thoughtfulbloke/fe616c3470ac46e8ee61452105824d34Sources:
Amount spent on houses-
The value of new housing stock which is not part of the previous property cycle of buying and selling. Via data from Aaron Schiff @aschiff on Twitter in early AugustAmount borrowed to spend on houses-
Reserve bank's records of monthly amounts of lending to housing by banks and other institutions -
Hard News: Harkanwal Singh: What really…, in reply to
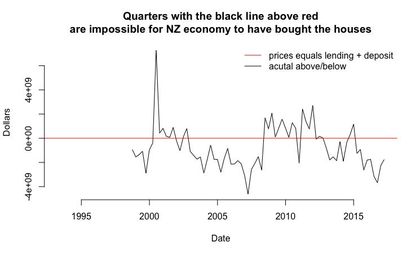
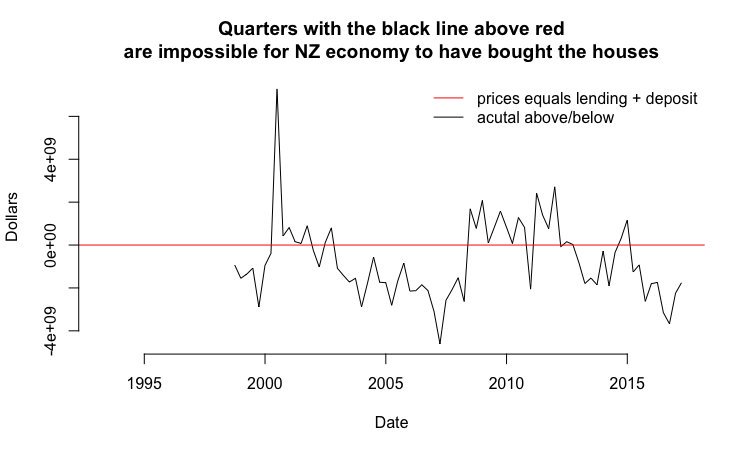
Since I did that first graph some years ago new data has become available.
It is a very time specific relationship. If you assume most house purchases had a 25% deposit, you can look at the quarterly amounts that were loaned in mortgages, the red line in this graph is the actual amount that was spent on houses (we know this now at a quarterly level through better data). Most of the time the amount the black line (amount borrowed in mortgages + 25% deposit) is below the red, which is easily explainable by the average deposits in that quarter being above 25%.
The times when the black line is above the red are when the pattern is not explicable by the long term finance pattern (stretching back to when records are available, detailed quarterly data is only from the late 90s). The 6 billion dollars more than explained by the NZ economy surge in a single quarter of 2001 matches in time when the Australian Government allowed negative gearing to be applied to Australians’ investments in foreign property.
That wall of money was the initial surge that soaked up all the spare capacity for what is perceived as the 2003 bubble, from which NZ has never recovered. Subsequent bubbles have been bubbles on bubbles.
I would also make the prediction that if Australia ever changes its negative gearing rules, we will see the results play out in the New Zealand property market.
-
Reason and ridicule may work better than empathy in stopping such beliefs
-
Hard News: Blockchain, what is it?, in reply to
Bitcoin is typically hashed using ASICs which are far more energy efficient.
The best estimate for bitcoin is 94 kWh per transaction. Working here: https://motherboard.vice.com/en_us/article/ypkp3y/bitcoin-is-still-unsustainable
-
Hard News: Blockchain, what is it?, in reply to
Have any of the crypto-currency/blockchain people solved the fundamental problem of power consumption?
Nope.
From a Motherboard/Vice article yesterday Ethereum transactions are estimated to take 45 kilowatt-hours of electricity per transaction, VISA is estimated at 0.00651 kWh per transaction.
-
Hard News: Fear of Cycling, in reply to
rather than the 1-2 you’d expect from the 1% number.
The expect really hinges on how much damage you expect people to take in an accident- giving the prevailing wisdom that the short term risk is balanced by the long term health benefits it starts to devolve into arguments about what a reasonable rate is.
Broadly speaking I would say everyone is safer in their own custom transport space, and pretty much all the risk is at shared spaces (i.e. intersections where all three groups intermix unavoidably).
-
Starting to get a few numbers in (some hospital data and road use data). In terms of fear of cycling and risks, cyclists have about as much risk of hospitalisation/death from stationary objects as cars (but the stationary objects are not in the hands of other people which is where the fear comes from).
For pedestrians if we take km traveled as an indicator of how much they are on the road, cyclists is almost exactly 1% of cars, however among pedestrian hospitalisations collisions with cyclists are at a rate of 2.83% of cars (95% confidence interval 1.84 to 4.2) suggesting that for hospitalisation injuries the risk to pedestrians is higher per cycle than per car.
-
Hard News: Fear of Cycling, in reply to
so I’m not sure shared pedestrian/cycleways are without drawbacks for bike-commutes.
The pedestrian cyclist issues in a shared carriageway do seem to mirror the cyclist car issues when they share space. As I understand it, in Japan the less vulnerable party in an accident is normally held responsible, so in general cars are held responsible for accidents with cycles, and cycles are held responsible for accidents with pedestrians. A couple of articles:
http://www.japantimes.co.jp/news/2015/06/29/reference/law-gets-serious-cycling-safety/#.WM8EtRhh3UI